Showing posts with label Forex. Show all posts

Wednesday, November 7, 2007

Support and Resistance

Support and resistance is one of the most widely used concepts in trading. Strangely enough, everyone seems to have their own idea on how you should measure support and resistance.

Let’s just take a look at the basics first.

Basic Support and Resistance

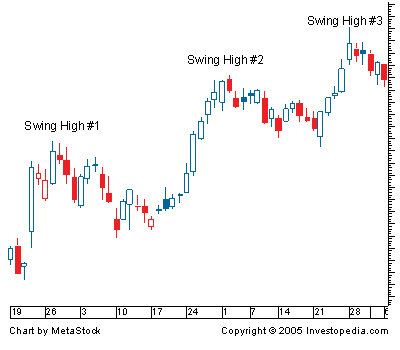
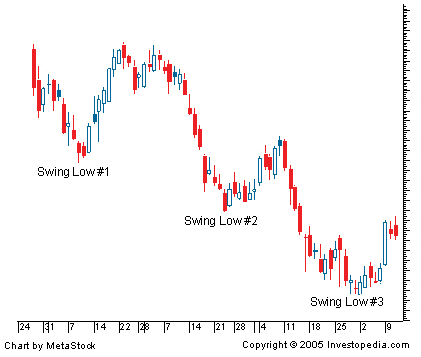
Look at the diagram above. As you can see, this zigzag pattern is making its way up (bull market). When the market moves up and then pulls back, the highest point reached before it pulled back is now resistance.

As the market continues up again, the lowest point reached before it started back is now support. In this way resistance and support are continually formed as the market oscillates over time. The reverse of course is true of the downtrend.

Plotting Support and Resistance

One thing to remember is that support and resistance levels are not exact numbers. Often times you will see a support or resistance level that appears broken, but soon after find out that the market was just testing it. With candlestick charts, these "tests" of support and resistance are usually represented by the candlestick shadows.

Notice how the shadows of the candles tested the 2500 resistance level. At those times it seemed like the market was "breaking" resistance. However, in hindsight we can see that the market was merely testing that level.

So how do we truly know if support or resistance is broken?

There is no definite answer to this question. Some argue that a support or resistance level is broken if the market can actually close past that level. However, you will find that this is not always the case. Let's take our same example from above and see what happened when the price actually closed past the 2500 resistance level.

In this case, the price had closed twice above the 2500 resistance level but both times ended up falling back down below it. If you had believed that these were real breakouts and bought this pair, you would've been seriously hurtin! Looking at the chart now, you can visually see and come to the conclusion that the resistance was not actually broken; and that it is still very much in tact and now even stronger.

So to help you filter out these false breakouts, you should think of support and resistance more of as "zones" rather than concrete numbers. One way to help you find these zones is to plot support and resistance on a line chart rather than a candlestick chart. The reason is that line charts only show you the closing price while candlesticks add the extreme highs and lows to the picture. These highs and lows can be misleading because often times they are just the "knee-jerk" reactions of the market. It's like when someone is doing something really strange, but when asked about it, they simply reply, "Sorry, it's just a reflex."

When plotting support and resistance, you don't want the reflexes of the market. You only want to plot its intentional movements.

Looking at the line chart, you want to plot your support and resistance lines around areas where you can see the price forming several peaks or valleys.

Other interesting tidbits about support and resistance:
  1. When the market passes through resistance, that resistance now becomes support.
  2. The more often price tests a level of resistance or support without breaking it the stronger the area of resistance or support is.

Support and Resistance

Source:http://www.babypips.com

Tuesday, October 30, 2007

Currency Traders

Forex, the largest financial market of the world can fetch you money. And it is possible only when you are pretty sure about your success in trading and know how to counter the odds of currency trading in adverse circumstances. A successful trader of currency trading needs to be awakened and alert about his proceedings and decisions. A little endeavor is made below to find out a few essential traits tagged with a successful trader of currency market.

Well, confidence comes at first. And it derives from learning. If you are new to currency market, make no move until you are confident about the aptness of your trading agreement. Go for some tutorials instead. If possible ask around; preferably the experts having years of expertise in currency trading. You can consider the courses and tutorials on currency trading which are usually designed by professionals. These courses are also available online. It means getting an expert for your currency trading is never a tedious task. No matter whether you are in pajamas or suits, a single click can do it all at the comfort of your own home.

A tutorial or course in currency trading will teach you the market basics, policies, trade secrets, how to opening and managing trade account, increasing profits and many more. These inputs and particulars will surely help you to get confident. Confidence is good but sometimes over confidence may lead you to loss. The mantra of successful forex trading says a trader should be rational not emotional. He should be confident but not above the heads.

Now how a trader could counter the odds of currency trading in adverse circumstances? Well, the answer lies in his experience. The more he trade in the currency market, more he will be able to gain the experience. On the course of getting the experience, he learns about the currencies, economies, trading in pairs, technical and fundamental analysis of currency trading and many more. All these contribute to his development as a perfect trader of currency market.

The forex market is volatile. Along with advantages, the market has certain calculated risks also. Being an awakened trader of currency market, you should have a nose for news regarding everything latest in currency trading. You should able to calculate the risks and counter them with a confident stroke of trading.

Summary: A successful trader of currency trading needs to be awakened and alert about his proceedings and decisions. Being an awakened trader of currency market, you should have a nose for news regarding everything latest in currency trading.


source:http://samples.blogforyou.com/blogs/samples/2007/10/01/currency-trading-in-forex/

Tuesday, October 23, 2007

Lets Prepare for The Competition

To all Profitable Traders Members

Date: From Monday to Friday only.
Time: 2.00 pm to 6.00 pm and 8.00 pm to 12.00midnight.
Address: 110-1, 1st floor, Jalan Puteri 5/1, Bandar Puteri, Puchong.

Subject:
1. For beginner - The basic forex technical chart analysis.
a. The Candlestick.
b. The Trendline.
c. The Pivot Point.
d. The indicators.

2.For intermediate - Technical chart analysis and Fundamental
analysis.
a. EMA Trading strategy.
b. RSI Trading strategy.
c. Stochastic Oscillators Trading strategy.
d. Parabolic SAR Trading strategy.
e. Pivot point Trading strategy.
f. Fibonacci Trading Strategy.

3.For taking part the FXcast FX competition course.
How to turn your USD 250 to be one of the Winner and take away the USD
5000.00.

All course will charge as below:
For beginner only MYR 70.00(as what other workshop charge > MYR
500.00.
For intermediate - MYR 150.00(as what other workshop charge > MYR
1000.00.
For FX competition - MYR 100.00(50% discount for those who have open
Live Trading account).
100% money back guarantee if you think is not worth it.

Trading competition

Super Trading Competition

An extraordinary opportunity for you! FXcast will pay 5 000 USD cash for the winner of the Super Trading competition circuit!!!
The biggest profit will be the winner.

What should you do?
Trading of course – and follow these guidelines:
Basics:
• Only Passport or Identity Card or Driver’s license needed as identification.
• Money can be sent with any of our payment options including bank wire.
• Trading starts on 1st of November at 0:00 GMT.
• Trading ends on 30th of November at 23:59 GMT.
• All open positions will be closed then to get the final Equity.
• The price will be paid to the winner on his account and booked to his trading account for immediate withdrawal.
• The winner will be published on our website with picture (if agreed), country and city. A start for your trader career?
• All participants which want to withdraw later on must send complete documents as written in our verification area.
• Trades must follow our trading rules, no scalping and no Expert Advisors allowed.

What to do now?
1. Become a customer of FXcast
2. Open a special trading account in your membership area
3. Transfer 250 USD to your competition account (Only USD allowed)
4. Start trading and become the winner
5. The Trader with the highest equity after all open positions have been closed will be our No. 1

Start NOW and do not miss this unique chance with FXcast and apply here: http://fxcast.com/contests.php

Sunday, October 21, 2007

Earn from Forex Trading & Networking

is a worldwide operating financial services corporation specializing on supporting currency traders of each status of knowledge and experience with high quality online trading services. With a team of dedicated financial specialists and technical support personnel, FXcast operates globally as a market maker and principal counterparty to retail customers and corporate customers and institutional traders. "Providing currency conversion services" is the main concern of FXcast. FXcast has established itself as an industry leader by offering unique trading software which is highly secured and reliable. The range and capabilities of FXcast software fits to everyone's needs and can be operated manually or fully automatic with auto-trade capabilities.

mission is to provide the opportunity for individuals and corporate customers around the world to trade currency markets under the most favourable conditions, such as enjoyed by financial institutes, banks, or brokerage companies. FXcast also offers customers to create and use automated trading systems and strategies to experiment with strategies, improve their trading skills and get acquainted with the system before buying and selling on a live market.

Introducing Brokers Program allows you to refer customers and earn from every trade executed by your referred customers or by customers of SUB-IB Levels referred by you. You can earn up to 1 pip (e.g. standard lot on EUR/USD is 100K, 1pip = $10) on every trade executed by referred customers. You can refer customers through your website or send them a promotion code per e-mail. Some customers execute 10 - 20 Lots with one trade, others make 15 -30 trades a day what is giving you possibilities to earn thousands each month by simply referring customers to FXcast. If you refer other IBs you will get rebates from each trade of their customers too. The more customers and IBs you bring the more commission per trade will be paid to you.

There are 4 levels of IBs:
  1. Master IB Level - The highest level for an IB.
    Rebates: 1 pip per traded lot for all customers introduced by yourself or 0.25 pip per traded lot from every customer introduced by any underlying IB, SUB IB, promotion partner;
  2. IB Level - The Standard level for an IB.
    Rebates: 0.75 pip per traded lot for all customers introduced by yourself or 0.25 pip per traded lot from any customer introduced by any underlying SUB IB, promotion partner;
  3. SUB-IB Level - The second level for an IB.
    Rebates: 0.50 pip per traded lot for all customers introduced by yourself or 0.25 pip per traded lot from any customer introduced by any underlying promotion partner;
  4. Promotion Partner Level - Entry level to the IB Program.
    Rebates: 0.10 pip per traded lot from any customer.

It is easy to apply for FXCast IB Program, all you need to do is register as FXCast member (membership is free), open a live trading account (trade for atleast 3 - 5 days) and you could submit your application as IB online.

For more info on FXCast or its IB Program, go to http://fxcast. com/?pr=20179.

Friday, October 5, 2007

Trading Using Moving average convergence divergence (MACD)

Moving average convergence divergence (MACD), invented in 1979 by Gerald Appel, is one of the most popular technical indicators in trading. MACD is appreciated by traders the world over for its simplicity and flexibility because it can be used either as a trend or momentum indicator.

Trading divergence is a popular way to use MACD histogram (which we explain below), but, unfortunately, the divergence trade is not very accurate - it fails more than it succeeds. To explore what may be a more logical method of trading MACD divergence, we look at using the MACD histogram for both trade-entry and trade-exit signals (instead of only entry), and how currency traders are uniquely positioned to take advantage of such a strategy.

MACD: An Overview
The concept behind MACD is fairly straightforward. Essentially it calculates the difference between an instrument's 26-day and 12-day exponential moving average (EMA). Of the two moving averages that make up MACD, the 12-day EMA is obviously the faster and the 26-day is the slower. In the calculation of their value, both moving averages use the closing prices of whatever period is measured. On the MACD chart, a 9-day EMA of MACD itself is plotted as well, and it acts as a trigger for buy and sell decisions. MACD generates a bullish signal when it moves above its own 9-day EMA, and it sends a sell sign when it moves below its 9-day EMA.

The MACD histogram is an elegant visual representation of the difference between MACD and its 9-day EMA. The histogram is positive when MACD is above its 9-day EMA and negative when MACD is below its 9-day EMA. If prices are rising, the histogram grows larger as the speed of the price movement accelerates and contracts as price movement decelerates. The same principle works in reverse as prices are falling. See Figure 1 for a good example of a MACD histogram in action.


Figure 1 - The above is an example of MACD histogram. Note that as price action (top part of the screen) accelerates to the downside, the MACD histogram (in the lower part of the screen) makes new lows and vice versa as prices turn.

As it responds to the speed of price movement, the MACD histogram is the main reason why so many traders rely on this indicator to measure momentum. Indeed, most traders use the MACD indicator more frequently to gauge the strength of the price move than to determine the direction of a trend.

Trading Divergence
As we mentioned earlier, trading divergence is a classic way in which the MACD histogram is used. One of the most common set-ups is to find chart points at which price makes a new swing high or a new swing low but the MACD histogram does not, indicating a divergence between price and momentum. Figure 2 illustrates a typical divergence trade.


Figure 2 - Here is a typical (negative) divergence trade using a MACD histogram. At the right-hand circle on the price chart, the price movements make a new swing high, but at the corresponding circled point on the MACD histogram, the MACD histogram is unable to exceed its previous high of 0.3307. (The histogram reached this high at the point indicated by the lower left-hand circle.) The divergence is a signal that the price is about to reverse at the new high, and as such, it is a signal for the trader to enter into a short position.

Unfortunately, the divergence trade is not very accurate - it fails more times than it succeeds. Prices frequently have several final bursts up or down that trigger stops and force traders out of position just before the move actually makes a sustained turn and the trade becomes profitable. Figure 3 demonstrates a typical divergence fakeout, which has frustrated scores of traders over the years.


Figure 3 - A typical divergence fakeout. Strong divergence is illustrated by the right circle (at the bottom of the chart) by the vertical line, but traders who set their stops at swing highs would have been taken out of the trade before it turned in their direction.

One of the reasons that traders often lose with this set up is they enter a trade on a signal from the MACD indicator but exit it based on the move in price. Since the MACD histogram is a derivative of price and is not price itself, this approach is in effect the trading version of mixing apples and oranges.

Using the MACD Histogram for Both Entry and Exit
To resolve the inconsistency between entry and exit, a trader can use the MACD histogram for both trade-entry and trade-exit signals. To do so, the trader trading the negative divergence takes a partial short position at the initial point of divergence, but instead of setting the stop at the nearest swing high based on price, s/he instead stops out the trade only if the high of the MACD histogram exceeds its previous swing high, indicating that momentum is actually accelerating and the trader is truly wrong on the trade. If, on the other hand, the MACD histogram does not generate a new swing high, the trader then adds to his or her initial position, continually achieving a higher average price for his or her short.


Currency traders are uniquely positioned to take advantage of this strategy because with this strategy, the larger the position, the larger potential gains once the price reverses - and in FX, you can implement this strategy with any size of position and not have to worry about influencing price. (Traders can execute transactions as large as 100,000 units or as little as 1,000 units for the same typical spread of three to five points in the major pairs.)

In effect, this strategy requires the trader to average up as prices temporarily move against him or her. This, however, is typically not considered a good strategy. Many trading books have derisively dubbed such a technique as "adding to your losers". However, in this case the trader has a logical reason for doing so - the MACD histogram has shown divergence, which indicates that momentum is waning and price may soon turn. In effect, the trader is trying to call the bluff between the seeming strength of immediate price action and MACD readings that hint at weakness ahead. Still, a well-prepared trader using the advantages of fixed costs in FX, by properly averaging up the trade, can withstand the temporary drawdowns until price turns in his or her favor. Figure 4 illustrates this strategy in action.


Figure 4 - The chart indicates where price makes successive highs but the MACD histogram does not - foreshadowing the decline that eventually comes. By averaging up his or her short, the trader eventually earns a handsome profit as we see the price making a sustained reversal after the final point of divergence.

Conclusion
Like life, trading is rarely black and white. Some rules that traders agree on blindly, such as never adding to a loser, can be successfully broken to achieve extraordinary profits. However, a logical, methodical approach for violating these important money management rules needs to be established before attempting to capture gains. In the case of the MACD histogram, trading the indicator instead of the price offers a new way to trade an old idea - divergence. Applying this method to the FX market, which allows effortless scaling up of positions, makes this idea even more intriguing to day traders and position traders alike.


By Boris Schlossberg, Senior Currency Strategist, FXCM
Access Boris' Exclusive FREE Report The 5 Things That Move The Market

Prime Online FX Broker

FXcast